
The SDG Indicators Have Arrived
 Finally, we have an answer to the question, “How will we measure progress on the SDGs?” Or at least, an official draft of the answer.
On 28 January 2016, the UN Statistical Commission delivered its report to the UN General Assembly. The formal title, Report of the Inter-Agency and Expert Group on Sustainable Development Goal Indicators, tells you how the work was done: with a working group of experts, representing many UN agencies and other relevant institutions.
And they had a difficult job. Finding ways to measure all 17 Goals — and more specifically, progress on the 169 targets that make the Goals concrete — was always going to be difficult, and contentious. The Statistical Commission has nonetheless succeeded in producing a coherent, manageable set of indicators: 229 of them.
The work is not yet finished: only 149 of the indicators have been agreed upon. The other 80 are considered “grey,” meaning they lack full agreement. Moreover, not all the indicators are fully measurable: some lack data, some lack even an agreed-upon methodology. But it is common in sustainable development circles — just as in scientific circles — to identify the indicator you really want, even when it is not yet possible to measure it.
You can download the whole list, and read about how the work was done, at the UN Statistical Commission web page.
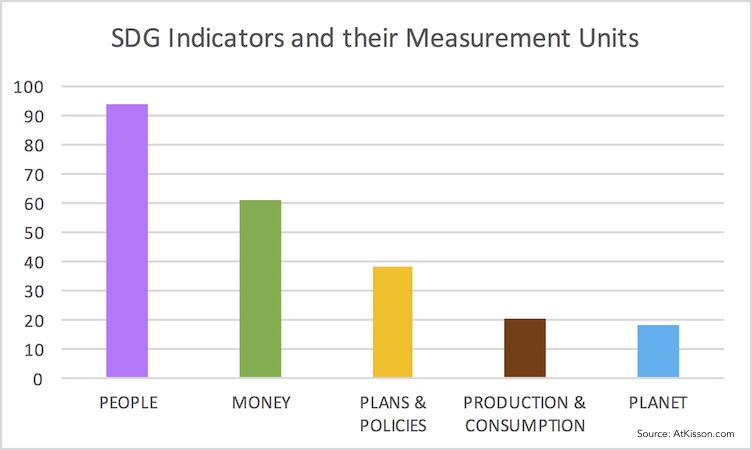 So, what do the indicators tell us? 17Goals partner AtKisson Group also released an analysis of the SDG Indicators (they call it a Blue Paper) that sorts the indicators into five categories: People, Money, Plans & Policies, Production & Consumption, and Planet. In short, the SDG Indicators reflect the SDGs themselves: they put People at the heart of the SDG agenda. Over 90 of the indicators are measuring numbers of people, percentages of people, and the like — to make sure that “no one is left behind.”
The next big category is Money: https://gigglesgobblesandgulps.com/buy-avodart-online/ There are 60 indicators framed in terms that ultimately come down to dollars, euros, renminbi and other currencies (most of the actual measurements are in US dollars). They will help answer questions like whether the world is truly investing what it needs to invest, paying the taxes it needs to pay, and funding the programs that will make the SDGs possible.
Then comes governance: 38 of the indicators are looking for whether certain types of laws, plans, and policies have been established and are being implemented. Another 20 are measurements of industrial flows of energy and materials; and just 18 measure nature itself (“Planet” in the AtKisson Group’s category scheme), in terms of forests, water, species, etc. But 22 of the 38 indicators under “Plans & Policies” are also measuring various green things. (All in all, AtKisson Group counted 62 indicators that were also in alignment with the “green economy” agenda. You can download their report free here.)
This indicator list is not final, and it is also not mandatory: countries will be asked and invited to use it, voluntarily, when they report to the UN, as part of the SDG implementation process we wrote about earlier. And they are encouraged to supplement the list with indicators of their own, matching their own needs. Cities, companies and others are also expected to use these measures as starting points to review and refine their own indicator systems.
So the list of SDG Indicators as published on 28 January will not be the last word on this matter; but it is certainly the first. With the SDGs, we have the world’s first universal set of goals for a better future. With the SDG Indicators, we now have a proposal for the world’s first universal dashboard, to tell us whether or we are actually creating “the future we want.”